
A Solutions Engineer walks into a customer meeting with a slide titled “The Threat Landscape.” It contains a world map with animated red dots representing cyberattacks, a counter showing millions of threats detected in the last hour, and five statistics about the rise of ransomware. The CISO has seen this slide thirty times from thirty different vendors. It means nothing.
Threat intelligence is one of the most powerful tools in a Solutions Engineer’s kit — and one of the most frequently abused. Used well, it establishes credibility, creates urgency, and connects your solution to real-world threats the customer is facing right now. Used poorly, it looks like FUD designed to scare the customer into buying something.
This post covers where to find credible threat intelligence, how to select the right data for your audience, how to structure it in a presentation, and how to use it during live demos — all without resorting to fear tactics.
Where to Find Current Threat Intelligence
Government and Industry Sources
These carry institutional authority. When you cite them, the customer knows you are referencing real data, not vendor marketing.
- CISA Known Exploited Vulnerabilities (KEV) Catalog: Continuously updated CVEs confirmed actively exploited in the wild. Federal agencies must remediate within specified timeframes. For private-sector customers, the KEV is a de facto priority list for patching. Updated regularly at cisa.gov.
- Verizon Data Breach Investigations Report (DBIR): The most widely cited annual breach analysis, covering tens of thousands of incidents with industry-specific breakdowns. Published annually. Particularly useful because it provides vertical-specific data.
- FBI IC3 Annual Report: Financial impact data on BEC, ransomware, and cybercrime. When a customer needs dollar figures to justify budget, the IC3 provides government-sourced numbers.
- MITRE ATT&CK Framework: The common language for describing attacker techniques. When you map a threat to ATT&CK, you speak the same language as the customer’s security team.
Vendor Annual Reports
The major vendors publish threat reports based on telemetry from millions of endpoints and networks:
- CrowdStrike Global Threat Report: Strong coverage of nation-state actors, eCrime groups, and breakout time metrics — the average time from initial compromise to lateral movement.
- Mandiant M-Trends: Focused on incident response data. Dwell time statistics, attack lifecycle analysis, and emerging tactics from hands-on engagements.
- Palo Alto Unit 42: Detailed ransomware trends, initial access vectors, and techniques observed in incident response.
- Cisco Talos Year in Review: Threat intelligence from one of the largest commercial teams, covering email threats, DNS-based attacks, and network-level trends.
Real-Time Sources
For demos and timely presentations: CISA Alerts and Advisories for active threats, Exploit-DB and NVD for CVE details, Shodan for exposed attack surface (use carefully), and GreyNoise for real-time exploitation attempts against specific CVEs.
How to Pick the Right Threats for the Audience
Match the Vertical
Use the DBIR’s industry breakdowns. Healthcare: ransomware and insider threats. Financial services: credential theft, BEC, and web application attacks. Manufacturing: ransomware disrupting operations, OT/ICS threats, and IP theft. Retail: payment card skimming and PCI compliance. Education: ransomware and student data privacy.
Match the Technology Stack
If the customer runs Fortinet, reference FortiOS CVEs that made the CISA KEV. If they are an M365 shop, reference BEC campaigns targeting M365. This specificity signals you understand their environment, not just the generic threat landscape.
Match the Audience Role
CISOs and VPs need business impact metrics — financial losses, regulatory penalties, breach frequency in their vertical. They need data that supports budget justification. Security operations teams need attack techniques, detection gaps, and dwell time metrics. Network and infrastructure teams need attack vectors targeting network infrastructure. IT Directors need risk reduction tied to business outcomes.
Structuring the Threat Landscape Slide
Most threat landscape slides are a wall of statistics. The audience reads them faster than you can present them, draws no conclusions, and forgets them immediately.
The 3-Stat Slide
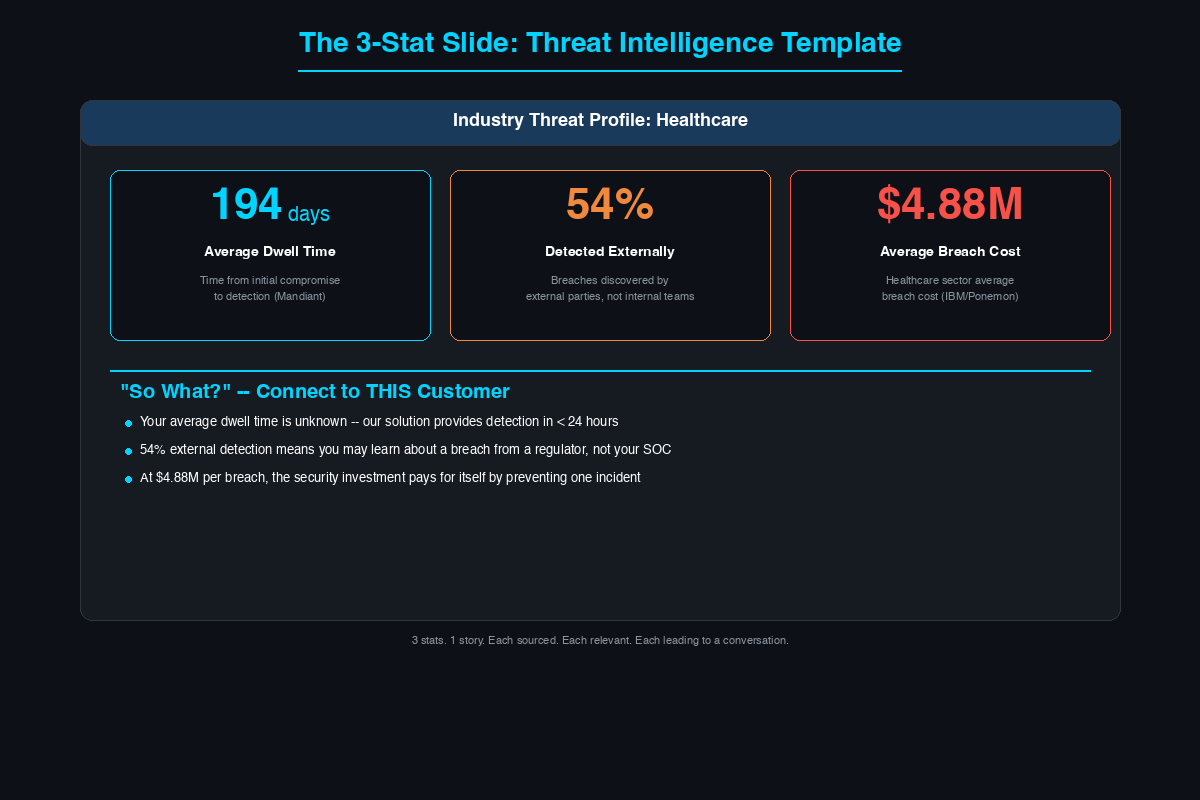
Pick three statistics that tell a story:
Stat 1 — The Scale: How widespread is the threat? For example, ransomware prevalence as a percentage of all confirmed breaches, sourced from the DBIR.
Stat 2 — The Impact: What happens when it hits? Average recovery cost for a mid-sized organization, sourced from a named report.
Stat 3 — The Relevance: Why does this matter to this customer? The specific increase rate in attacks targeting their vertical, sourced with year-over-year data.
Three stats. One story. Each one sourced. Each one relevant to the audience in the room.
The “What Changed” Slide
Instead of static statistics, show change over time. Decreasing breakout times year-over-year, increasing vulnerability exploitation as an initial access vector, or accelerating ransomware deployment timelines. Change tells a story of acceleration that naturally leads to conversations about automated detection and response.
The CVE Spotlight Slide
Pick one specific CVE that is on the CISA KEV, relevant to the customer’s technology stack, and detectable by your solution. Show the CVE number, a one-sentence description, the KEV deadline, and how your solution addresses it. This is not a generic threat — it is a specific vulnerability being actively exploited that affects technology the customer has deployed.
Urgency Without FUD
There is a line between urgency and fear. Urgency uses specific, sourced data to create informed action. Fear uses vague, exaggerated threats to create panic.
The Framework: What Is Happening, Why It Matters, How We Help
What is happening: Cite the specific vulnerability, campaign, or trend with sources and dates.
Why it matters to you: Connect it to the customer’s environment based on what you learned in discovery. If they run the affected technology, say so. If their vertical is disproportionately targeted, show the data.
How we help: Show the specific detection, prevention, or response capability. Map it to the threat you just described.
Notice what this framework does not do: it does not exaggerate, invent consequences, or pressure the customer. The urgency comes from the facts, not the delivery.
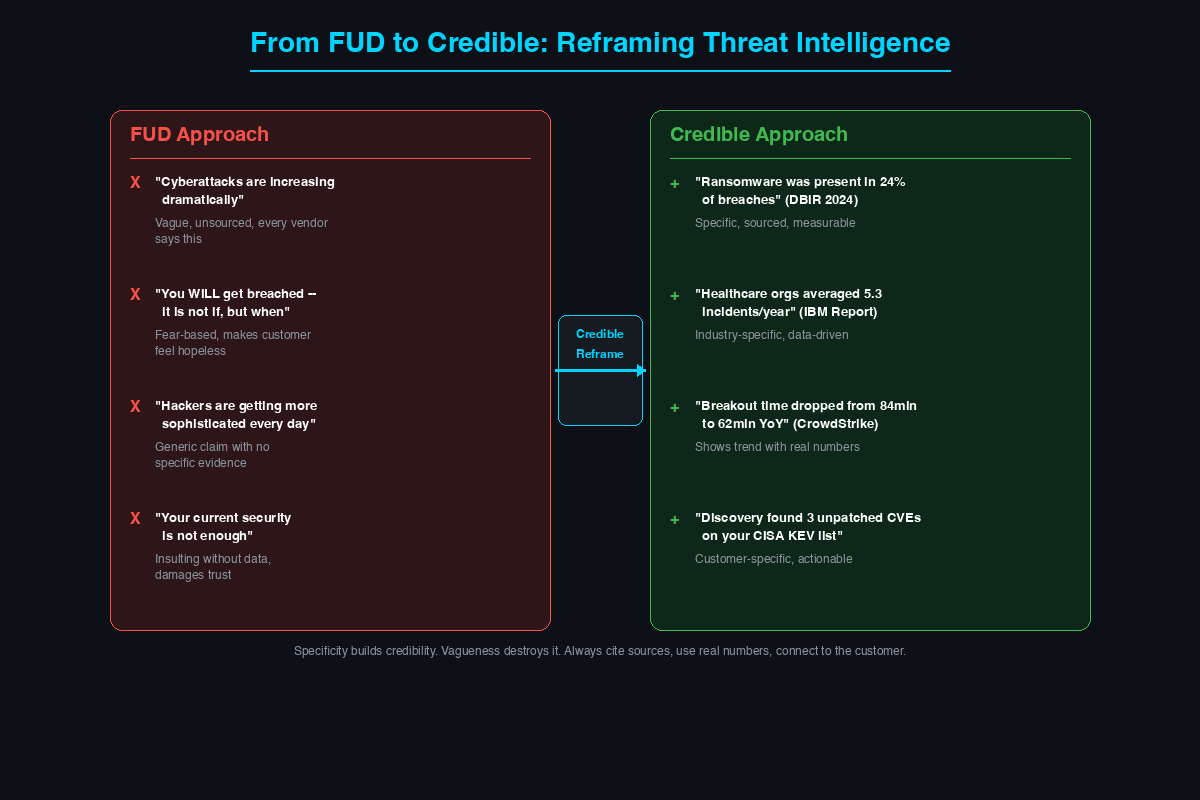
| FUD Statement | Credible Alternative |
|---|---|
| “Cyberattacks are increasing dramatically” | Cite a specific percentage increase from a named report with the year and metric |
| “You will be breached — it is not if, but when” | Cite average incidents per year in the customer’s vertical from a sourced study |
| “Hackers are getting more sophisticated” | Cite decreasing breakout times from CrowdStrike with specific year-over-year numbers |
| “Your current security is not enough” | Identify the specific gap from discovery and cite a relevant data point about that gap |
The Presentation Framework
Slide 1 — Industry Threat Profile (2 minutes): Three vertical-specific statistics, each sourced. Do not read them aloud — narrate the story they tell together.
Slide 2 — The Specific Threat (3 minutes): One current threat directly relevant to the customer. An APT group targeting their vertical, a CVE in their technology, or a technique that exploits a gap in their architecture.
Slide 3 — The Gap Analysis (2 minutes): Connect the threat to the customer’s current architecture. Based on what they told you in discovery, what would happen if this threat hit them today?
Slide 4 — The Solution (5 minutes): Now — and only now — show how your solution addresses the gap. Map it to the specific threat. The sequence matters: threat, gap, solution. Not solution, features, then threat as an afterthought.
Live Threat Intelligence Demo Techniques
Pull up the CISA KEV live: Open the KEV catalog in the browser. Filter for the customer’s technology. Show actively exploited CVEs affecting systems they run. Switch to your product and show the IPS signatures or threat feeds that detect those CVEs. The connection is immediate.
Show real-time threat data: Point to a specific blocked event in the product’s threat dashboard — a C2 callback attempt, a connection to known ransomware infrastructure, or an exploit attempt against a recent CVE. This is not a simulation. That is a real event.
Map an attack to ATT&CK: Choose a recent high-profile breach. Map the attacker’s techniques to MITRE ATT&CK. Show, technique by technique, where your solution provides detection or prevention at each step of the kill chain.
The vertical-specific threat briefing: Open the meeting with a 5-minute briefing of current threats specific to the customer’s industry — recent advisories, new CVEs, current campaigns from the last 30 days. This positions you as a trusted advisor monitoring their threat landscape, not just a vendor with a product to sell.
Common Mistakes to Avoid
Outdated data: Statistics from three years ago signal you did not prepare. Always use the most recent available reports.
Unattributed vendor claims: “We see 10 billion threats per day” means nothing without context. Always explain what the metric measures and cite the source.
Too many statistics: Fifteen on one slide means the audience processes none of them. Three is the right number. Five is the maximum.
Fear over empowerment: The customer should leave thinking “we need to act” — not “we are already doomed.” If your presentation makes the customer feel hopeless, you crossed the line from intelligence to manipulation.
Ignoring maturity level: Presenting APT attack chains to an organization that has not deployed MFA is tone-deaf. Match threat sophistication to the customer’s security maturity. If they are working on fundamentals, talk about commodity threats.
Threat intelligence is the bridge between abstract security concepts and the specific risks facing the customer in the room. When you show a CISO that a vulnerability being actively exploited right now affects their environment, and then demonstrate how your solution detects that exact exploitation — you have done something no feature comparison spreadsheet can do. You have connected the product to the real world. Source your data. Pick three things that matter, not fifteen that do not. Tell the story of what is happening, why it matters to this customer, and how you help. And never open with the animated world map of red dots.
Related Posts in This Series
- MITRE ATT&CK Framework Explained for Solutions Engineers — ATT&CK is a primary framework for organizing threat intelligence in presentations
- The SE’s Guide to Reading a Vulnerability Report — Vulnerability data is key threat intelligence to include in customer meetings
- How to Demo a Firewall Without Boring the Room — Weave threat intelligence into live demos for compelling storytelling
- How to Stay Current on Cybersecurity — Build the daily habits that keep your threat intelligence knowledge fresh
- Incident Response Plan Template for Mid-Market — Threat intelligence informs the detection and escalation phases of IR plans
Practice with free flashcards, quizzes, and hands-on lab scenarios at cciesec.it-learn.io — built specifically for the CCIE Security v6.1 written (350-701 SCOR) and lab exam.


