

A weekend project that turned into the consulting deliverable I wish I’d had three customer engagements ago: a read-only ISE audit that pulls 52 endpoints over ERS and OpenAPI, derives findings, maps them to a prioritized remediation catalog, and renders an HTML / PDF report you can hand a customer the same afternoon.
Repo: github.com/asarmiento85/cisco-ise-automation
In the previous ISE automation post I walked through deploying ISE 3.4 from scratch in one evening. This one is the opposite direction: how do you assess an ISE deployment that already exists, without changing a thing, and produce something a customer can actually act on?
The awkward question every ISE consultant gets
“We want you to audit our ISE deployment and tell us what to clean up. We can’t give you full admin. We’re not sure we want you running scripts on it. We don’t really have time to walk you through everything either. What can you do?”
There’s no clean answer. The options form a tradeoff between customer comfort and audit depth:
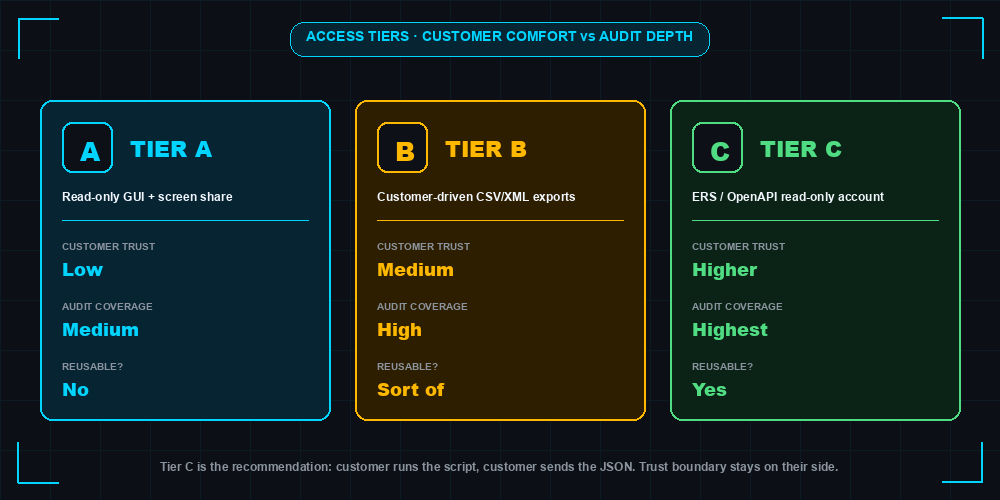
The row most people get wrong is the one that isn’t on the table: “just send me the ISE config backup file.” That .tar.gpg is not an offline-readable artifact. It’s an encrypted Oracle/CARS DB dump engineered for restore, not inspection. Even decrypted, you’d need to restore it into a lab ISE node of the same patch level to interpret it. So “just send me a config backup” - which sounds like the cleanest customer-friendly option - actually buys you nothing.
The thing that’s both deep and repeatable is read-only API access. But that’s the one customers push back on the hardest. So I built a thing that makes the pushback easier to overcome.
What I built
python/
├── ise_api/
│   ├── audit.py            # collector + heuristic analyzer + secret redactor
│   └── recommendations.py  # remediation catalog (REC-* keyed)
├── scripts/
│   └── audit_deep.py       # CLI — pulls data, analyzes, renders report
├── templates/
│   └── report.html.j2      # print-friendly Jinja2 template
└── audit-output/           # generated reports (gitignored)
A single CLI invocation:
1cd python
2uv sync --extra report
3uv run python -m scripts.audit_deep --pdf
Produces three artifacts at the same timestamp:
audit-<ts>.json- full structured dump (~500 KB), diffable across runsaudit-<ts>.html- same content, browser-viewable (~60 KB)audit-<ts>.pdf- print-ready 18-page report (~140 KB)
Every API call is a GET. The script cannot modify ISE state even if you wanted it to. The audit account needs only ERS Operator role - not Super Admin.
What it pulls
52 endpoints across ERS and OpenAPI. The shape:
- Deployment & system - nodes, personas, patches, hotpatches, smart-license state, repositories, backup schedule
- Identity - user identity groups, endpoint identity groups, internal users (metadata only), admin users, identity source sequences, AD join points, external RADIUS
- Network devices - full NAD detail with IPs, NDGs, CoA port; the NDG library
- Policy - network access - policy sets, per-set authentication / authorization / exception rules, condition library, allowed protocols
- Policy - device admin (TACACS+) - policy sets, per-set rules, command sets, shell profiles
- Profiler - full profiler policy catalog
- TrustSec - SGTs, SGACLs, egress matrix cells
- Guest - guest types, sponsor groups, portals
- Authorization profiles & dACLs
- Certificates - system certs on PAN (friendly name, used-by, signature algorithm, expiration), trusted-cert store
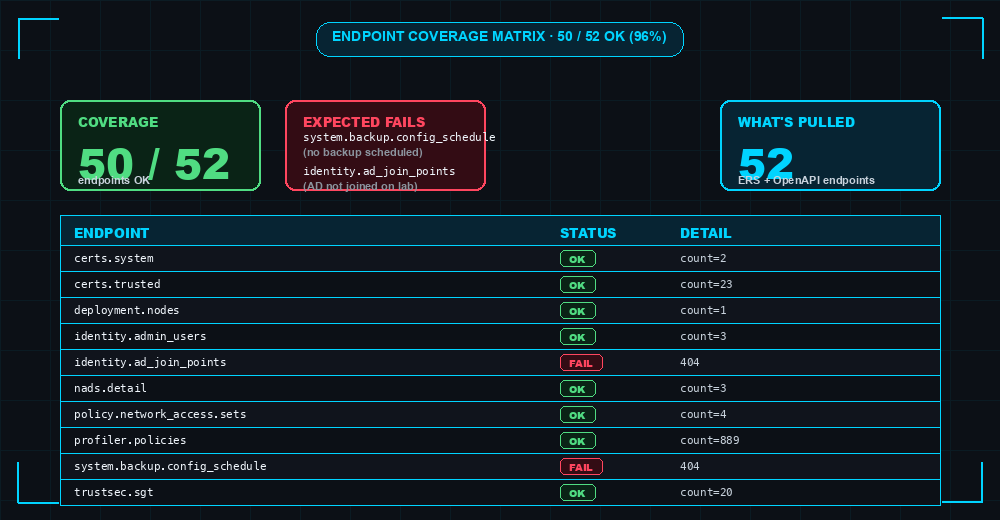
Every call is defensive. Endpoints that don’t exist on the deployment (older patch, disabled persona, feature off) are skipped silently and noted in a coverage matrix at the end of the report. On my dCloud sandbox I see 50 of 52 endpoints OK (96%) - the two failures (backup-schedule and ad-join-points) are expected when those features aren’t configured.
The executive summary
The first page after the cover is the only page most customers will read in full. It has to land the point in 30 seconds. Twelve metric cards, color-coded:
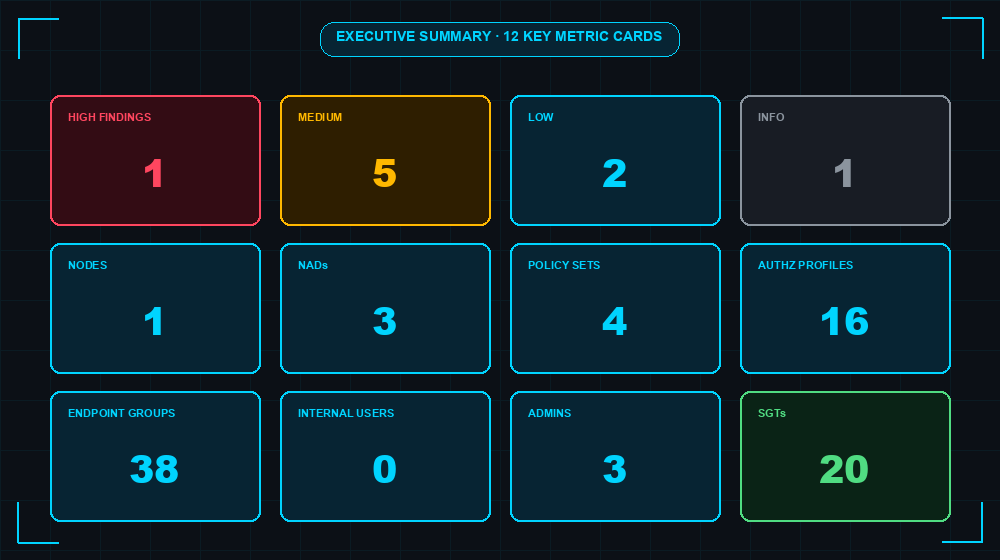
The HIGH card in red is the lede. If there’s a single number a customer remembers from the audit, this is it. Everything else is supporting context - how big is the deployment (NADs), how complex (POLICY SETS, AUTHZ PROFILES), how is identity structured (ADMINS, ENDPOINT GROUPS).
The heuristic analyzer
Raw data isn’t an audit. Findings are. The analyzer walks the dataset and emits findings with severity (high / med / low / info), category, message, and a recommendation key.
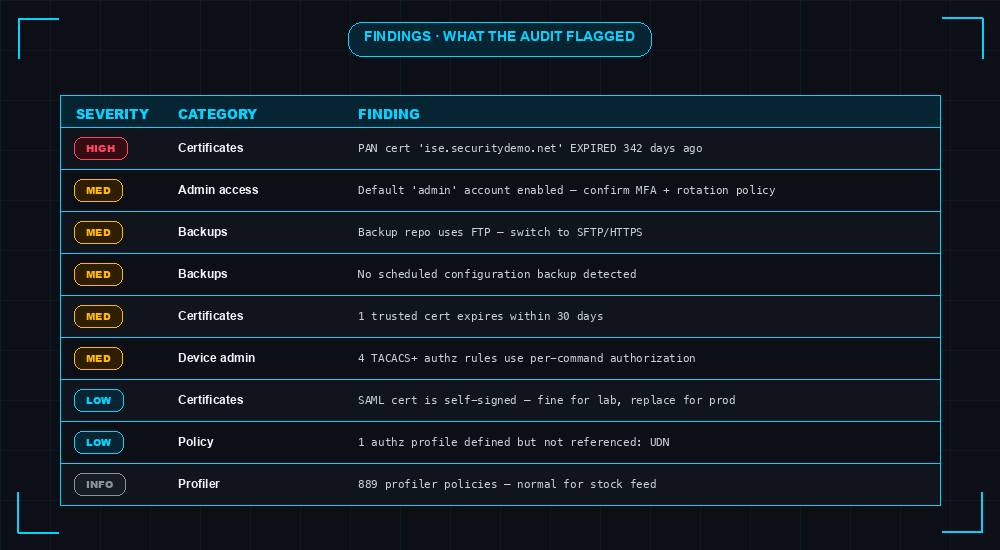
The TACACS finding on row 6 is the one I’m proudest of. The audit independently flagged the exact pattern I’d previously caused an outage with - per-command authorization without a tested break-glass path. The script saw 4 such rules on the lab and called it out without any human guidance.
Other heuristics that earn their keep:
- Expired or near-expiry certificates - both the system cert chain on the PAN and the trusted-cert store. Tied to “expires within 30 days” alerts that catch things before EAP-TLS breaks.
- Backup repo over insecure protocol - FTP is still common in older deployments; SFTP/HTTPS catches the credential leakage.
- Default
adminaccount enabled - every audit catches this; named admin accounts backed by AD/MFA are the modern pattern. - Unused policy elements - authorization profiles that no rule references. Inflates the catalog and increases the chance of accidentally selecting the wrong one in a new rule.
- Self-signed certificates in production - fine for labs, but on the PAN they cause permanent “Not Secure” warnings for admins and EAP clients.
The analyzer is the easiest part of the codebase to extend. New rule = new function, registered in the analyzer list. Every rule benefits everyone who runs the audit next.
The recommendations engine
Findings tell the customer what’s wrong. Recommendations tell them what to do. This is the part most audit tools skip.
The recommendation catalog holds 17 keyed remediations (REC-CERT-001, REC-TACACS-001, etc.) plus 4 always-on operational hygiene recs (REC-OPS-*). Each one looks like this when rendered in the report:
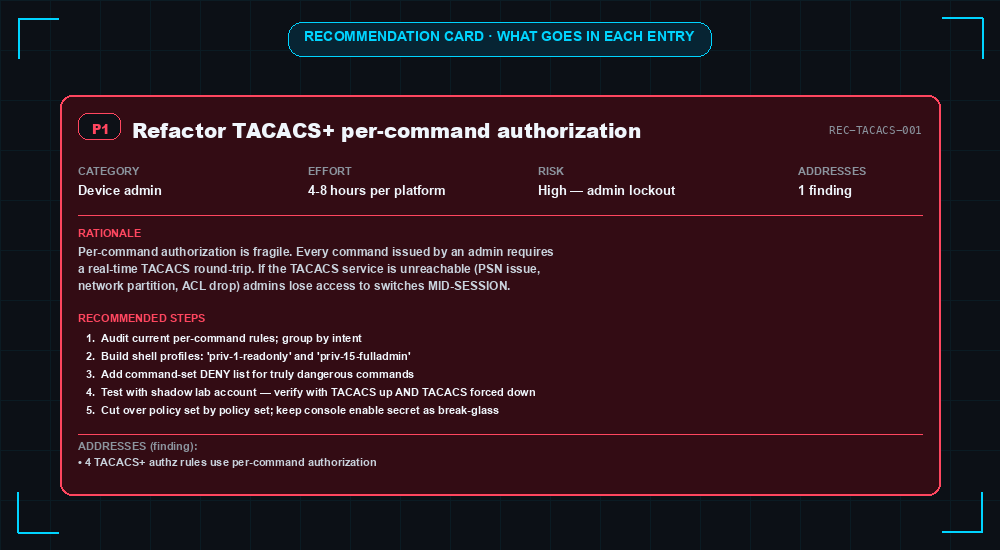
In the Python it’s a dictionary literal:
 1"REC-TACACS-001": {
 2    "title": "Refactor TACACS+ per-command authorization to deny-list shell profiles",
 3    "category": "Device admin",
 4    "priority": "P1",
 5    "effort": "4-8 hours per platform",
 6    "risk": "High — can lock admins out of network gear",
 7    "rationale": (
 8        "Per-command authorization is fragile: every command issued by an admin "
 9        "requires a real-time TACACS round-trip. If the TACACS service is "
10        "unreachable..."
11    ),
12    "steps": [
13        "Audit current per-command rules; group commands by intent.",
14        "Build 1-2 shell profiles: 'priv-1-readonly' and 'priv-15-fulladmin'.",
15        "Add a command-set DENY list for truly dangerous commands.",
16        "Test with a shadow lab account; verify with TACACS up AND with TACACS forced down.",
17        "Cut over policy set by policy set; always keep a console enable secret as break-glass.",
18    ],
19}
Findings are mapped to recommendations by key, deduped, and sorted by priority. P1 means act this sprint. P2 plan this quarter. P3 opportunistic cleanup. Each recommendation card in the report shows category, effort, risk, rationale, numbered steps, and the specific findings it addresses.
The 4 always-on operational hygiene recs apply regardless of findings:
- REC-OPS-001 - Establish a quarterly read-only audit cadence (run this thing every three months)
- REC-OPS-002 - Document and test the break-glass procedure
- REC-OPS-003 - Subscribe to Cisco PSIRT advisories for ISE
- REC-OPS-004 - Verify patch and hotpatch latency against current train
The report
The HTML and PDF share a single Jinja2 template (python/templates/report.html.j2) with print-friendly CSS. WeasyPrint renders the same HTML to PDF - one source of truth, two output formats.
The PDF structure:
| § | Section |
|---|---|
| 1 | Cover page |
| 2 | Executive summary (severity counts + key metric cards) |
| 3 | Findings table |
| 4 | Recommendations (the actionable section, grouped P1/P2/P3) |
| 5 | Deployment |
| 6 | Network access devices |
| 7 | Identity (admin users, AD join points, ID source sequences) |
| 8 | Policy - network access (per policy set: auth + authz rules) |
| 9 | Policy - device admin (TACACS+) |
| 10 | Authorization profiles & dACLs |
| 11 | TrustSec (SGTs, SGACLs, egress matrix) |
| 12 | Guest & portals |
| 13 | Profiler |
| 14 | Certificates (system + trusted) |
| 15 | Backups & repositories |
| 16 | Endpoint coverage matrix |
One thing I obsessed over: orphaned headings. CSS page-break-after: avoid is widely supported but unreliable in WeasyPrint when content after the heading is large. The fix is a chain - h2 + * glues the first sibling to the heading, AND h2 + p glues the intro paragraph to whatever comes after - so the heading + intro + first content block all travel as one unit. If they can’t fit on the current page, the engine pushes the whole block to the next page.
Secrets - the trap I almost shipped
ISE’s ERS API returns several fields in plaintext to authenticated admins:
radiusSharedSecretsharedSecret(TACACS)secondRadiusSharedSecretsnmpRoCommunity/snmpRwCommunitypasswordfields on internal users / reposkeyEncryptionKey,messageAuthenticatorCodeKey
This is intentional - it’s the same as what the GUI shows when you edit a NAD. But it means the first time I ran the audit and looked at the JSON dump, my dCloud lab’s RADIUS shared secret was sitting in cleartext in audit-output/*.json.
The fix is a recursive redactor at the end of collect():
 1_SECRET_FIELD_NAMES = {
 2    "radiusSharedSecret", "sharedSecret", "secondRadiusSharedSecret",
 3    "keyEncryptionKey", "messageAuthenticatorCodeKey",
 4    "password", "enablePassword",
 5    "snmpRoCommunity", "snmpRwCommunity",
 6    "tacacsSharedSecret", "privateKey",
 7}
 8
 9def _redact(obj):
10    if isinstance(obj, dict):
11        return {k: ("<REDACTED>" if k in _SECRET_FIELD_NAMES else _redact(v))
12                for k, v in obj.items()}
13    if isinstance(obj, list):
14        return [_redact(x) for x in obj]
15    return obj
One chokepoint, applied once in collect(), sanitizes everything downstream: JSON, HTML, PDF. Plus python/audit-output/ is gitignored so reports never accidentally land in a public repo.
I verified by grepping the final output for known secret tokens across all three formats:
=== JSON ===   'dCl0ud-Lab-...':  0 hits   REDACTED: 9 hits
=== HTML ===   'dCl0ud-Lab-...':  0 hits
=== PDF  ===   'dCl0ud-Lab-...':  0 hits
Belt and suspenders. The audit-output directory is gitignored so reports never leak to a public repo even by accident.
Customer-friendly delivery
Here’s the answer to the original awkward question. Offer the customer a tier (see the diagram earlier in this post):
Tier A - Read-only admin + screen share. Customer creates a custom RBAC role under Admin Access → Authorization → Permissions with read-only on all menus, binds it to a fresh local admin account, and either screen-shares while you walk through it or records a Webex per your checklist. Zero data leaves their environment.
Tier B - Customer-driven exports. Customer hands you GUI exports (policy sets as XML, NADs as CSV, certs as a listing, the output of ISE’s built-in Health Checker). You analyze offline. No API needed.
Tier C - Run this script. Customer creates an ERS Operator account, optionally allowlists your source IP, and they run the script (or you run it during a call they’re on). They get the same JSON/HTML/PDF you do. Diffable across quarters.
The pitch I use for Tier C with security-conscious customers:
“You run this, not me. The repo is public - read it before running. It’s all GETs. The account can be disabled the second we’re done. Send me the JSON.”
That moves the trust boundary from “let a consultant into our API” to “let a consultant read a structured file we produced.” Same outcome, very different customer comfort.
What’s in the repo
Everything is at github.com/asarmiento85/cisco-ise-automation. The audit-specific pieces:
| Path | What’s there |
|---|---|
python/ise_api/audit.py | The collector + analyzer + secret redactor |
python/ise_api/recommendations.py | Remediation catalog (17 keyed recs + 4 hygiene recs) |
python/scripts/audit_deep.py | The CLI (--pdf, --json-only, --out) |
python/scripts/audit_sample.py | Lightweight live console version (no template engine required) |
python/templates/report.html.j2 | The Jinja2 report template (HTML + print CSS) |
python/pyproject.toml | Optional [report] extra: jinja2 + weasyprint |
README.md | The “Auditing an existing deployment” section with full usage |
To try it yourself against any ISE 3.x deployment:
1git clone https://github.com/asarmiento85/cisco-ise-automation
2cd cisco-ise-automation/python
3cp ../.env.example ../.env   # fill in ISE_HOST / ISE_USERNAME / ISE_PASSWORD
4uv sync --extra report
5uv run python -m scripts.audit_deep --pdf
Reports land in python/audit-output/ (gitignored).
What I’d build next
A few directions this could go:
--diff <previous.json>mode - quarterly re-audits would show what changed since last time. Drift detection becomes nearly free.- Excel export of recommendations -
recommendations.xlsxwith columns for priority, owner, due date, status. Customers drop it straight into their ticketing tool. - Sanitized “shareable” HTML mode - strips IPs and hostnames so the report can be pasted into a Jira ticket without leaking topology.
- More OpenAPI coverage - pxGrid clients, certificate templates, posture conditions, SXP. ISE 3.2+ exposes more every release.
- Pair with the ITDR scoring layer - quarterly audit findings could feed the ITDR engine’s baseline as static “known good” deviations to ignore vs novel anomalies to surface.
If you end up running it against a real deployment and the heuristics miss something obvious in your environment, open an issue - the analyzer is the easiest part to extend, and every new rule benefits everyone who runs it next.
Related Posts
- Building a Production-Grade Cisco ISE Deployment in One Sitting - the deployment story this audit tool was built alongside
- The TACACS+ Lockout That Taught Me Three Things About IOS-XE AAA - the postmortem the TACACS+ heuristic was specifically built to catch
- ITDR on Cisco ISE: Behavioral Identity Scoring with AWS Serverless - the architecture this audit tool slots into as a “drift detector”
- Cisco ISE Profiling: Device Fingerprinting Configuration Guide - companion ISE configuration content
- Cisco ISE TACACS+ Device Admin Guide - Done Safely - the “right way” TACACS+ setup the audit recommends migrating to
Audit tool tested against Cisco ISE 3.4 on the dCloud sandbox via ERS + OpenAPI. The visualizations in this post are recreated in the blog’s style; the source-of-truth output is the rendered HTML/PDF from the actual tool. Repo MIT-licensed, audit-output gitignored.
Practice with free flashcards, quizzes, and hands-on lab scenarios at cciesec.it-learn.io — built specifically for the CCIE Security v6.1 written (350-701 SCOR) and lab exam.


