
If you can read Windows event logs, you can reconstruct what happened on a Windows host. If you cannot, you are guessing.
This post is the field guide. We cover the event IDs that actually show up in investigations, what each one means in context, how to correlate them across logs, the gotchas that fool beginners, and the queries that turn raw .evtx files into a defensible timeline.
Where event logs live and how they are structured
Windows event logs are .evtx files (XML-based, since Vista) stored under %SystemRoot%\System32\winevt\Logs\. The three logs that matter most for forensics are:
- Security.evtx — authentication, authorization, audit policy, account management. The primary investigation source.
- System.evtx — driver loads, service starts/stops, system shutdown/startup, hardware changes. Useful for persistence detection.
- Application.evtx — application crashes, third-party software events. Less universal but sometimes critical (the application that crashed at a specific time may be the one that processed the malicious file).
Each event has:
- An Event ID (numeric, 4-5 digits, scope is “within the providing source”)
- A provider (the Windows component or app that wrote the event)
- A timestamp (UTC in the underlying record; the GUI may display local time)
- Event data (structured fields specific to that event ID)
- A record number (sequential — gaps indicate log clearing or rotation)
The same Event ID number can mean completely different things across different logs. “Event ID 1” in the Security log is EVENT_AUDIT_LOG_CLEAR; “Event ID 1” in Sysmon is “process creation.” Always pair the Event ID with its provider.
The event IDs every investigator memorizes
There are a few thousand documented Windows event IDs. You do not memorize them all. You memorize the dozen that appear in 90% of investigations.
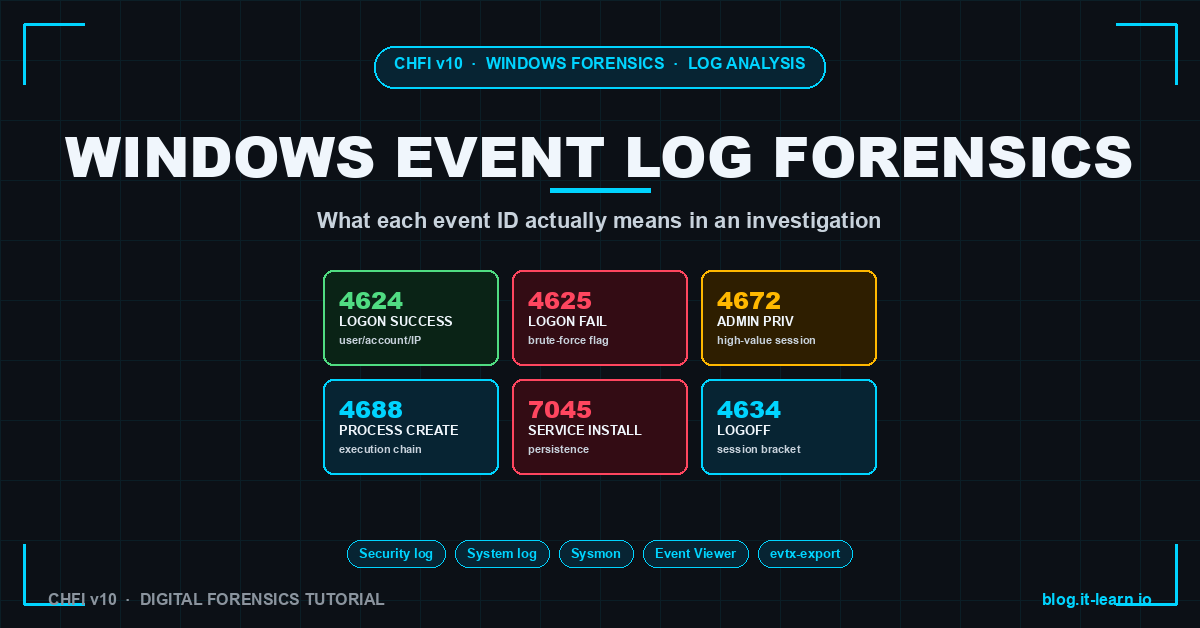
4624 — Successful Logon
The starting point of most investigations. Fields to read:
- Account Name — who logged in
- Workstation Name — where they logged in from (source machine)
- Source Network Address — source IP if remote
- Logon Type — how they logged in:
2Interactive (console)3Network (SMB, file share)5Service7Unlock (already-authenticated session unlock)10RemoteInteractive (RDP)11CachedInteractive (offline cached credentials)
- Authentication Package —
NTLM,Kerberos,Negotiate - Logon Process —
Advapi,User32,seclogo - Logon GUID — unique identifier that lets you correlate this logon to its logoff (Event 4634)
In an investigation, Logon Type 10 from an unexpected source IP is the classic compromised-account indicator. Logon Type 3 to a workstation that should never be accessed via SMB indicates lateral movement.
4625 — Failed Logon
Same fields as 4624 plus a Sub Status Code that tells you why the logon failed:
0xC000006A— bad password (account exists)0xC0000064— account does not exist0xC000006D— bad password or account locked0xC0000234— account locked out0xC000006F— account logon time restriction0xC0000071— password expired
Burst patterns matter. 50 events of 4625 with code 0xC000006A against one account in 60 seconds = password spray. 50 events of 4625 with code 0xC0000064 (account does not exist) against different account names = username enumeration. Different attacks, same Event ID, different patterns.
4634 / 4647 — Logoff
4634 is the “logoff” event. 4647 is “user-initiated logoff.” Pair these with the matching 4624 via Logon GUID to bracket session duration.
Logoff events are easy to miss because attackers do not generate them. If you see 4624 with no matching 4634/4647, the session may still be active — or the attacker may have forcefully terminated.
4672 — Special Privileges Assigned to New Logon
Generated whenever an account logs on with administrative privileges. Useful in two ways:
- Filter for high-value sessions — only sessions with 4672 are admin-capable
- Detect privilege escalation — a normally-non-admin user generating 4672 means the account got escalated (or was always admin and you missed it)
4688 — Process Creation
Native Windows process auditing. Off by default — enabled via:
Audit Policy → Detailed Tracking → Audit Process Creation: Success
Group Policy → Computer Config → Administrative Templates → System
  → Audit Process Creation → Include command line in process creation events: Enabled
Without the command-line GPO, you only see process names, not arguments. With it, you see the full command line — including powershell -enc <base64> payloads.
Fields to read:
- New Process Name — the executable
- Creator Process Name — the parent (what spawned this)
- Process Command Line — the full invocation
- Token Elevation Type —
TokenElevationTypeDefault,TokenElevationTypeFull,TokenElevationTypeLimited
Parent-child anomalies are the classic detection. winword.exe spawning cmd.exe? outlook.exe spawning powershell.exe? svchost.exe spawning rundll32.exe with an unusual command line? All flag in 4688.
For deeper detail, pair native 4688 with Sysmon Event ID 1 — Sysmon adds parent command line, file hash, and user SID that 4688 omits. See Living Off the Land: LOLBins for the attack patterns these events catch.
7045 — Service Installed
In the System log (not Security). Generated every time a new service is installed. Fields:
- Service Name — typically random or vendor-mimicking when malicious
- Service File Name — the binary path; legit services live in
%SystemRoot%\System32\or%ProgramFiles%; malicious ones often in%TEMP%,%APPDATA%, or user profile paths - Service Type —
kernel mode driver,user mode service,interactive service - Start Type —
auto,demand,disabled
Persistence detection. Attackers install services to maintain access across reboots. A 7045 with a binary path under %APPDATA% or %TEMP% is almost always malicious. A 7045 from a user account (not SYSTEM) is unusual and worth investigating.
1102 — Audit Log Cleared
In the Security log. Always investigated. Windows always logs this event regardless of audit policy because clearing the log is itself security-relevant.
If you see 1102, the audit log was deliberately cleared. The username and timestamp on the 1102 event itself become a primary lead. Cross-reference to backups (if log forwarding is in place) to recover the cleared events.
4720 / 4722 / 4724 / 4732 / 4738 — Account Management
The account-management events tell you when accounts were created, enabled, password-reset, added to privileged groups, or modified. A burst of these in a short window often indicates attacker persistence:
4720— User account created4722— User account enabled4724— Password reset attempt4732— Member added to a security-enabled local group (look for Administrators, Remote Desktop Users)4738— User account changed
An attacker who just popped a domain admin creates accounts under unusual names, adds them to Domain Admins, and uses them as fallback. The account-management event chain is the signature.
4768 / 4769 / 4771 — Kerberos
Domain controller events. Critical for AD-environment investigations:
4768— Kerberos TGT (Ticket Granting Ticket) request — initial domain authentication4769— Kerberos service ticket request — authentication to a specific service4771— Kerberos pre-authentication failed — typically bad password against AD
A burst of 4768 from one source against many accounts = AS-REP roasting attempt. See Kerberoasting for the attack pattern these events catch.
How to read events in context
A single event in isolation tells you very little. The forensic value comes from chained sequences:
TIMELINE FROM ACTUAL INCIDENT (illustrative)
────────────────────────────────────────────────────────────────────
2026-05-15 02:14:08  4625  Account: alice  Code: 0xC000006A  (bad pw)
2026-05-15 02:14:09  4625  Account: alice  Code: 0xC000006A
2026-05-15 02:14:11  4625  Account: alice  Code: 0xC000006A
...        45 events ...
2026-05-15 02:14:54  4624  Account: alice  Logon Type: 10 (RDP)   ← cracked
                          Source: 185.x.x.x
2026-05-15 02:15:02  4672  Account: alice  ← admin
2026-05-15 02:16:11  4688  Process: cmd.exe  Parent: explorer.exe
2026-05-15 02:16:15  4688  Process: powershell.exe -enc <base64>
                          Parent: cmd.exe
2026-05-15 02:17:42  7045  Service: WinSvcMgr  Path: %APPDATA%\update.exe
                          User: alice   ← persistence installed
2026-05-15 02:18:01  4720  Account created: bk_admin
2026-05-15 02:18:08  4732  Member added: bk_admin → Administrators
2026-05-15 02:19:12  1102  Audit log cleared by: alice   ← cover-up
That sequence — failed logons, then success, admin privilege, process spawn chain, service install, account creation, log clear — is the canonical attacker timeline. Each individual event is unremarkable; together they tell the whole story.
Querying .evtx files
Three approaches in increasing power:
Event Viewer (GUI)
Built-in, no install. Filter Current Log → Event ID → comma-separated list. Good for triage and small investigations. Painful for cross-log correlation.
PowerShell — Get-WinEvent
Built-in, scriptable, decent performance:
 1# All failed logons in the last 24 hours
 2Get-WinEvent -FilterHashtable @{
 3  LogName='Security'; ID=4625;
 4  StartTime=(Get-Date).AddHours(-24)
 5} | Format-Table TimeCreated, Id, Message -AutoSize
 6
 7# Process creation events with PowerShell as the process
 8Get-WinEvent -FilterHashtable @{LogName='Security'; ID=4688} |
 9  Where-Object {$_.Message -match "powershell.exe"} |
10  Select-Object TimeCreated, Message
11
12# Account creation events
13Get-WinEvent -FilterHashtable @{LogName='Security'; ID=4720} |
14  Select-Object TimeCreated, @{n='Account';e={$_.Properties[0].Value}}
evtx-tools / python-evtx — for offline images
When you have an evidence image and want to parse .evtx files offline without a Windows host:
1# Convert .evtx to XML for analysis
2python-evtx Security.evtx > security.xml
3
4# evtx_dump — fast Rust-based parser, JSON output
5evtx_dump -o jsonl Security.evtx > security.jsonl
6
7# Then grep / jq / pandas / your favorite tool
8cat security.jsonl | jq 'select(.Event.System.EventID == 4625)'
For larger investigations, ingest into a SIEM (Splunk for example) and use SPL or KQL for cross-event correlation.
Common gotchas
1. Default audit policy logs almost nothing. Most Windows installations have Audit Process Creation, Audit Logon, Audit Account Management, and Audit Object Access either disabled or set to Failure only. If you arrive at an incident and the Security log has nothing useful, this is why.
2. Event log size limits cause rotation. Default Security log is 20 MB. On a busy server, that holds maybe 6 hours of events. Older events overwrite silently. Always pull the log as soon as practical, before rotation eats the evidence.
3. Time skew across hosts breaks correlation. If the suspect workstation’s clock is 3 minutes off from the DC, your cross-log timeline will be 3 minutes off. Always verify and document time sync state at acquisition.
4. The “Description” GUI field is just a template. The structured data is in the underlying XML. Tools that read the description string instead of the raw event data will miss fields and fail when the description format changes.
5. WMI and PowerShell remoting events are in their own logs. Microsoft-Windows-WMI-Activity/Operational and Microsoft-Windows-PowerShell/Operational are not in the Security log. If you only check Security, you miss most modern attacker activity.
6. Service installs sometimes show up in System, sometimes in Application. Always check both for 7045-style persistence indicators.
7. Cleared logs leave 1102 but no other forensic trace of what was deleted. Recovery requires log-forwarding infrastructure (Windows Event Forwarding, SIEM ingest) that was in place before the incident.
Hands-on lab
Set up Sysmon and a verbose audit policy on a test VM:
 1# Enable command-line auditing
 2auditpol /set /subcategory:"Process Creation" /success:enable /failure:enable
 3
 4# Install Sysmon with a standard config (SwiftOnSecurity's is canonical)
 5Invoke-WebRequest https://raw.githubusercontent.com/SwiftOnSecurity/sysmon-config/master/sysmonconfig-export.xml -OutFile sysmonconfig.xml
 6.\Sysmon64.exe -accepteula -i sysmonconfig.xml
 7
 8# Generate some interesting activity
 9powershell -enc "JABzAD0AJwBoAGUAbABsAG8AJwA="
10runas /user:administrator cmd
11
12# Then look at what was captured
13Get-WinEvent -LogName 'Microsoft-Windows-Sysmon/Operational' -MaxEvents 20 |
14  Format-Table TimeCreated, Id, Message -Wrap
You will see the difference Sysmon makes immediately — full command lines, hashes, parent process tree.
CHFI exam tips
Topics this post covers that appear on the CHFI v10 (312-49) exam:
- The major Security log Event IDs (4624, 4625, 4634, 4672, 4688, 4720, 4732, 4738, 1102)
- Logon types and what each one means
- The difference between native Windows auditing and Sysmon
- How
.evtxfiles are stored and how to parse them offline - Log clearing detection (Event 1102) and what to do about it
- Account management events as persistence indicators
- Kerberos events (4768/4769/4771) in domain environments
Scenario questions are common: “An examiner sees 50 Event 4625 events from a single source IP in 60 seconds followed by a successful Event 4624 from that same IP — what attack is this?” Answer: password spray or brute force, followed by successful credential compromise.
Related Posts
- Disk Imaging in Forensics: dd vs FTK Imager vs Autopsy — how to acquire the evidence the event logs live on
- Chain of Custody: The Single Mistake That Loses Court Cases — what to do with the event log evidence after extraction
- Living Off the Land: LOLBins — the attacker tradecraft Event 4688 catches
- Pass-the-Hash: Why the Hash Is as Good as the Password — what 4624 Logon Type 3 across many hosts reveals
- Splunk + Cisco ISE Syslog Integration RADIUS Dashboard — pattern for ingesting events into a SIEM for correlation
Practice with free flashcards, 1,200 questions, and 15 forensics modules at forensics.it-learn.io — built specifically for the CHFI v10 exam (312-49). Free with a quick signup.
Tested against Windows Server 2022 and Windows 11 23H2 with Sysmon 15.14 and SwiftOnSecurity config. Event IDs and field names valid for Windows Vista and later.


