
Disk forensics tells you what was written. Memory forensics tells you what is happening.
The most interesting attacker activity in 2026 does not touch disk. Fileless malware lives in PowerShell process memory. Cobalt Strike beacons stage in injected RWX regions. Encryption keys exist only at runtime. Network connections to C2 servers are kernel state, not filesystem state. A disk-only forensic examination misses all of it.
This post is the first-walkthrough of Volatility 3 — the de facto open-source memory forensics framework. We cover capture, the symbol-driven analysis that replaced manual profile selection, the eight plugins that cover 80% of investigations, and the worked example of finding injected code in a real memory dump.
By the end you should be able to point Volatility 3 at any Windows memory image and find the malicious activity in under 30 minutes.
What memory forensics actually sees
A memory dump is a raw snapshot of RAM at a specific instant. The contents:
Kernel structures — the EPROCESS list of every running process, the ETHREAD list of every thread, the SSDT (System Service Descriptor Table), driver objects, device objects, loaded modules.
Per-process state — virtual memory regions, loaded DLLs, open handles, command-line arguments, environment variables, security tokens, the heap, the stack.
Network state — active TCP connections, listening sockets, UDP endpoints, with source/destination IPs and ports, owning PID.
Decrypted artifacts — strings, certificates, encryption keys, browser session cookies, password manager unlock state, all decrypted at runtime and present in process memory.
In-memory rootkits — code patches, hooked SSDT entries, hidden processes (unlinked from the EPROCESS list but still scheduled), all visible to memory analysis even when they evade live OS queries.
The disk has none of that. Even live OS commands (Task Manager, tasklist, netstat) can be lied to by rootkits that filter the OS APIs. Memory forensics goes around the OS APIs and reads kernel structures directly.
Capture — before you can analyze, you have to acquire
Order of volatility says: capture memory before doing anything else. Once the system powers off or reboots, RAM is gone.
Live Windows capture:
1# WinPmem — Velocidex, free, fast, MIT
2.\winpmem.exe -o memdump.raw
3
4# DumpIt — MoonSols, free
5DumpIt.exe   # writes <hostname>-<date>.raw to the current directory
6
7# FTK Imager Lite — combined disk + memory capture
8# Use the GUI: File → Capture Memory
VMware:
1# Suspend the VM in vCenter or via CLI:
2vmrun suspend "/path/to/VM/VM.vmx"
3
4# The resulting .vmem file IS the memory image
5ls /path/to/VM/*.vmem
Linux:
1# LiME (Linux Memory Extractor) — free, kernel-module-based
2sudo insmod ./lime.ko "path=/mnt/evidence/memdump.lime format=lime"
3
4# Or AVML (AzureLinuxMemoryLoader) — Microsoft, easier setup
5sudo ./avml memdump.lime
File size: the dump is ~the size of physical RAM. A 32 GB workstation = 32 GB dump file. Plan storage and transfer accordingly.
Hash immediately: sha256sum memdump.raw and record the hash in the chain of custody. Re-verify before analysis.
Volatility 3 setup — 5 minutes
 1# Clone the official repo
 2git clone https://github.com/volatilityfoundation/volatility3
 3cd volatility3
 4
 5# Install dependencies (Python 3.8+)
 6pip install -r requirements.txt
 7# Or with uv:
 8uv pip install -r requirements.txt
 9
10# Verify
11python3 vol.py --help
That is the entire setup. No profile database to download (Volatility 2 required this). No symbol files to install manually — Volatility 3 fetches Windows PDB symbols automatically from Microsoft on first run for any unknown OS build.
The first command — see what’s running
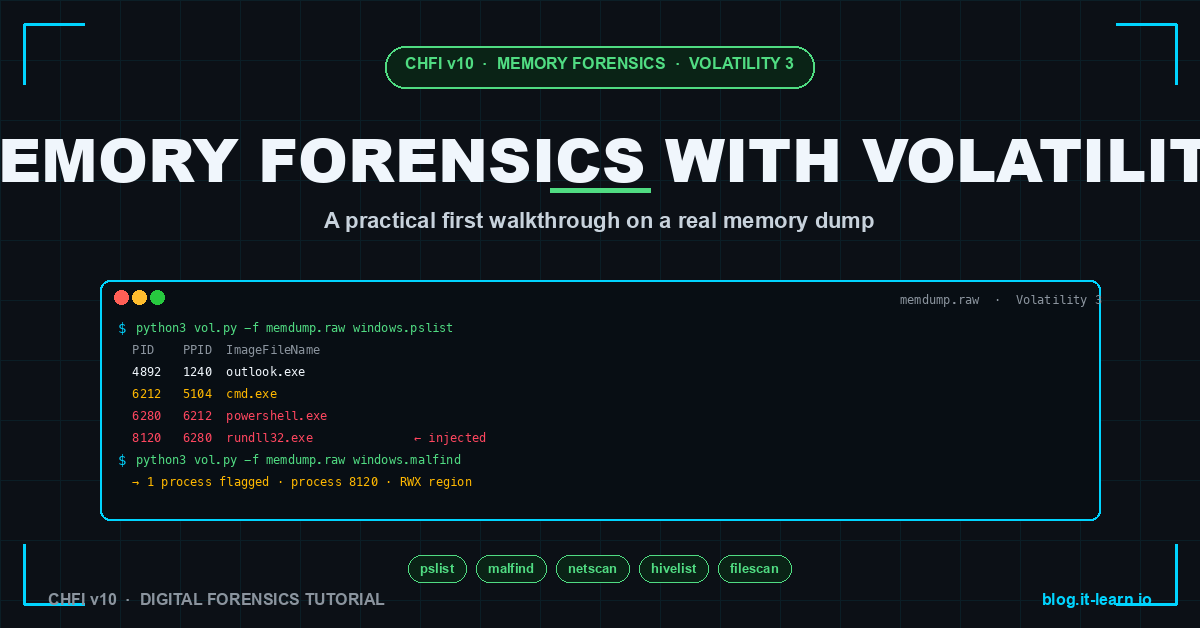
1python3 vol.py -f memdump.raw windows.pslist
That command lists every running process at capture time. Output looks like:
PID    PPID  ImageFileName  Offset(V)         Threads  Handles  SessionId  Wow64  CreateTime
4      0     System         0xffffba8a01234   200      -        N/A        False  2026-05-15 09:00:01
72     4     Registry       ...
260    4     smss.exe       ...
540    532   csrss.exe      ...
612    604   wininit.exe    ...
...
4892   1240  outlook.exe    ...                32       512      1          False  2026-05-15 09:12:33
5104   4892  winword.exe    ...                15       312      1          False  2026-05-15 09:14:11
6212   5104  cmd.exe        ...                3        45       1          False  2026-05-15 09:14:42
6280   6212  powershell.exe ...                5        201      1          False  2026-05-15 09:14:43
8120   6280  rundll32.exe   ...                4        67       1          False  2026-05-15 09:14:51
That parent-child chain — outlook → winword → cmd → powershell → rundll32 — is the canonical macro-borne dropper. Same pattern visible in Windows Event Log Event 4688, but here you can see it after the fact in memory even if the events were cleared.
The 8 plugins that cover 80% of investigations
1. windows.pslist — process list
What it shows: every process Volatility found by walking the kernel’s EPROCESS linked list.
Limitation: rootkits can unlink processes from this list, hiding them.
2. windows.pstree — process tree
Same data as pslist but rendered as a tree. Spotting parent-child anomalies is much faster than scrolling a flat list.
1python3 vol.py -f memdump.raw windows.pstree
3. windows.cmdline — process command lines
What did each process actually run with? Critical for finding powershell -enc <base64> invocations.
1python3 vol.py -f memdump.raw windows.cmdline
4. windows.psscan — process scan (catches hidden processes)
Where pslist follows the linked list, psscan scans the entire memory pool for EPROCESS structures regardless of whether they’re linked. Compare pslist output to psscan output — any process in psscan but not pslist has been hidden, which is a strong rootkit indicator.
1python3 vol.py -f memdump.raw windows.psscan
5. windows.malfind — suspicious memory regions
The single highest-signal plugin. Scans process memory for indicators of code injection:
- Pages marked
PAGE_EXECUTE_READWRITE(RWX is suspicious — normal code isRX, normal data isRW, but rarely both) - Pages without a backing file (indicating runtime-allocated executable memory)
- Pages starting with common shellcode signatures (
MZheaders in non-PE allocations, opcode patterns)
1python3 vol.py -f memdump.raw windows.malfind
Output lists each flagged region with a hex dump of the first bytes — usually you can see the MZ header or the shellcode jump pattern immediately.
6. windows.netscan — network connections
Active TCP / UDP endpoints at the time of capture. Includes listening sockets, established connections, owning PID. Often shows C2 callbacks that have already disconnected from any live netstat view.
1python3 vol.py -f memdump.raw windows.netscan
7. windows.hivelist — registry hives in memory
Windows loads registry hives into memory. With hivelist + windows.printkey, you can extract registry data from the memory image even if disk hives were wiped:
1python3 vol.py -f memdump.raw windows.hivelist
2
3# Then dump a specific hive's Run key for persistence detection
4python3 vol.py -f memdump.raw windows.printkey \
5  --offset <hive-offset-from-hivelist> \
6  --key "Microsoft\Windows\CurrentVersion\Run"
8. windows.dlllist — loaded DLLs per process
Lists every DLL loaded in each process’s address space. Useful for detecting DLL injection — a DLL loaded into a process that shouldn’t have it:
1python3 vol.py -f memdump.raw windows.dlllist --pid 8120
If powershell.exe has a DLL loaded from %TEMP%\suspicious.dll, that is injection. Legitimate DLLs come from \Windows\System32\ and \Program Files\.
The 30-minute investigation pattern
Given a fresh memory dump and zero context, here is the order that almost always finds the malicious activity within 30 minutes:
 1# 1. Process tree — eyeball for parent-child anomalies (Office → cmd/PS, etc.)
 2python3 vol.py -f memdump.raw windows.pstree
 3
 4# 2. Diff pslist vs psscan — anything hiding?
 5python3 vol.py -f memdump.raw windows.pslist > pslist.txt
 6python3 vol.py -f memdump.raw windows.psscan > psscan.txt
 7diff <(awk '{print $2}' pslist.txt | sort) <(awk '{print $2}' psscan.txt | sort)
 8
 9# 3. Malfind — injection / shellcode
10python3 vol.py -f memdump.raw windows.malfind > malfind.txt
11
12# 4. Command lines — encoded PowerShell, suspicious arguments
13python3 vol.py -f memdump.raw windows.cmdline | grep -iE "enc|base64|http|temp"
14
15# 5. Network — outbound connections, listening backdoors
16python3 vol.py -f memdump.raw windows.netscan
17
18# 6. For each suspicious PID from steps 3-5 — DLL list
19python3 vol.py -f memdump.raw windows.dlllist --pid <suspicious-pid>
20
21# 7. Dump the suspicious process memory for follow-up analysis
22python3 vol.py -f memdump.raw -o /evidence/dumps windows.memmap --pid <suspicious-pid> --dump
That sequence has caught more in-memory threats than any other Volatility workflow.
Worked example — finding the injection
Memory dump from a workstation that called the SOC about “slowness.” The user has not noticed anything else wrong.
1# Step 1 — process tree
2$ python3 vol.py -f case-001.raw windows.pstree
3...
44892   1240  outlook.exe
5* 5104    4892   winword.exe              ← email attachment opened
6** 6212    5104    cmd.exe                ← Word should never spawn cmd
7*** 6280   6212     powershell.exe -enc Pw...  ← encoded payload
8**** 8120  6280      rundll32.exe         ← injected child
The pattern is the textbook macro dropper. We already have enough to start, but let’s confirm with malfind:
1# Step 3 — malfind on the suspicious chain
2$ python3 vol.py -f case-001.raw windows.malfind
3Process: rundll32.exe  Pid: 8120
4  Start VPN: 0x1f2a00000
5  End VPN:   0x1f2a0ffff
6  Tag: VadS  Protection: PAGE_EXECUTE_READWRITE
7  ...
8  Disasm:
9    0x1f2a00000 4d5a90...   MZ header  ← injected PE file in non-PE memory
That MZ header in an RWX region inside rundll32.exe is injected code. We have confirmation.
1# Step 5 — what is this process talking to?
2$ python3 vol.py -f case-001.raw windows.netscan | grep 8120
30xfffffa80 TCPv4 10.0.5.42:49231 → 185.x.x.x:443 ESTABLISHED 8120 rundll32.exe
Outbound HTTPS to a known-bad IP from the injected rundll32.exe. That is the C2 callback.
1# Step 7 — dump the process memory for malware reverse engineering
2$ python3 vol.py -f case-001.raw -o /evidence/dumps windows.memmap --pid 8120 --dump
3Wrote pid.8120.dmp (47 MB)
4
5# Now hand pid.8120.dmp to the malware team for unpacking
Total elapsed time: 12 minutes from “open Volatility” to “C2 server identified + memory dumped for RE.” That is what memory forensics enables.
Common gotchas
1. The dump must be the same Windows version Volatility supports. Volatility 3 fetches symbols automatically for known builds, but a very new Windows release may not yet have PDB coverage. Check the version with windows.info first.
1python3 vol.py -f memdump.raw windows.info
2. Encrypted disks complicate memory analysis. A BitLocker-enabled system has the volume master key in memory at runtime. Capture before reboot or you lose the key. Volatility plugin windows.bitlocker can extract VMKs from memory.
3. Process injection comes in many flavors. Malfind catches RWX + non-backed pages. Other injection techniques (process hollowing, atom-bombing, DLL sideloading) need different plugins (windows.hollowprocesses, windows.threads).
4. Large dumps are slow. A 64 GB memory image takes 15-30 minutes per plugin pass on most workstations. Plan accordingly — script the eight-plugin sequence and let it run while you do other analysis.
5. Memory is volatile — you cannot re-acquire. Unlike disk imaging where you can re-image if you mess up, memory is gone after reboot. Always capture before doing anything that might cause a reboot or BSOD.
6. Anti-forensics is real. Some malware checks for Volatility-like signatures in its environment and self-destructs. Capture from outside the OS (hypervisor snapshot) when possible to avoid alerting attackers.
Hands-on lab — 30 minutes
 1# 1. Download a sample memory image
 2wget https://github.com/volatilityfoundation/volatility3/wiki/Samples \
 3  # Pick any Windows sample image listed there
 4
 5# 2. Clone Volatility 3
 6git clone https://github.com/volatilityfoundation/volatility3
 7cd volatility3
 8
 9# 3. Run the 30-minute investigation pattern
10python3 vol.py -f sample.raw windows.info
11python3 vol.py -f sample.raw windows.pstree
12python3 vol.py -f sample.raw windows.malfind
13python3 vol.py -f sample.raw windows.netscan
14python3 vol.py -f sample.raw windows.cmdline
Even on benign sample images, you will see the structure of the output. On any of the published “infected sample” dumps (Cridex, Stuxnet excerpts, BlackEnergy), you will see exactly what an investigation looks like.
CHFI exam tips
Memory forensics topics on the CHFI v10 (312-49) exam:
- Order of volatility (memory > network state > disk > backups)
- Memory acquisition tools (WinPmem, DumpIt, LiME, AVML)
- Volatility framework architecture and plugin model
- Difference between pslist (linked list walk) and psscan (pool tag scan) and what discrepancies imply
- Indicators of code injection (RWX pages, non-backed executable memory, MZ headers)
- The plugin set for network and registry analysis
- Symbol/profile concepts and Volatility 3’s automated symbol fetching
Scenario question pattern: “An examiner runs pslist and psscan against the same memory image. A process appears in psscan but not pslist. What does this indicate?” Answer: the process has been unlinked from the EPROCESS list — strong rootkit indicator. Investigate the process further with malfind and dlllist.
Related Posts
- Disk Imaging in Forensics: dd vs FTK Imager vs Autopsy — companion acquisition skill set
- Chain of Custody: The Single Mistake That Loses Court Cases — what to do with the memory image and its analysis
- Windows Event Log Forensics: What Each Event ID Actually Means — disk-side evidence that complements memory findings
- EXIF Metadata in Digital Forensics — adjacent specialized forensic skill set
- Living Off the Land: LOLBins — the in-memory attacker tradecraft that memory forensics catches
Practice with free flashcards, 1,200 questions, and 15 forensics modules at forensics.it-learn.io — built specifically for the CHFI v10 exam (312-49). Free with a quick signup.
Tested against Volatility 3 v2.7.0 on Windows 11 and Windows Server 2022 memory dumps captured with WinPmem 4.0.


