
In the previous post on this tool I walked through the why — the consulting tradeoff between customer comfort and audit depth, why ERS-API access beats every other option, and what the tool does at an architectural level. This post is the opposite end of the stack: the actual quickstart. How an ISE admin (or a consultant guiding one) gets from a freshly-cloned repo to a downloadable PDF report in under five minutes, with no Python knowledge required.
Repo: github.com/asarmiento85/cisco-ise-automation
What you need before starting
Three things:
- A workstation that can reach the ISE Primary Admin Node (PAN) over HTTPS (port 443). If you can open the ISE admin page in your browser from the same machine, you’re good.
- The ISE hostname or IP, plus a username and password for an account with ERS read access. Ask your ISE admin for a read-only
audit-readonlyaccount in the ERS Operator group — that’s it. - macOS, Windows, or Linux. No administrator rights required for the install.
If your ISE admin hasn’t enabled the ERS API or created the audit account yet, the customer-audit runbook in the repo walks them through that — it’s a 10-minute task, done once.
Step 1 — Install uv (one-time, ~1 minute)
uv is a small open-source tool that handles Python installation and dependency management automatically — you do not need to install Python yourself first. It’s the missing piece that makes “just clone the repo and run it” actually work cross-platform.
macOS / Linux — open Terminal and paste:
1curl -LsSf https://astral.sh/uv/install.sh | sh
Windows — open PowerShell and paste:
1powershell -ExecutionPolicy ByPass -c "irm https://astral.sh/uv/install.ps1 | iex"
Close and re-open your terminal so the uv command is on your PATH, then confirm:
1uv --version
If you see a version number, you’re done. This step never has to be repeated.
Step 2 — Download the audit tool
Two options depending on whether git is on the box.
With git:
1git clone https://github.com/asarmiento85/cisco-ise-automation.git
2cd cisco-ise-automation
Without git — open https://github.com/asarmiento85/cisco-ise-automation in a browser, click the green Code button, choose Download ZIP, unzip it, and open a terminal in the unzipped folder.
Either way you end up with a folder containing a python/ subdirectory. That’s where the audit code lives.
Step 3 — Start the audit web app
One command:
1cd python
2uv run --extra web python -m scripts.serve
The first time you run this, uv will spend about 30 seconds downloading Python and the audit’s dependencies (Flask, WeasyPrint, requests, Jinja2, a couple of helpers). After that, the web app starts in under a second on every subsequent run.
Your default browser opens http://127.0.0.1:8765 automatically. If it doesn’t, open that address yourself. You’ll see this form:
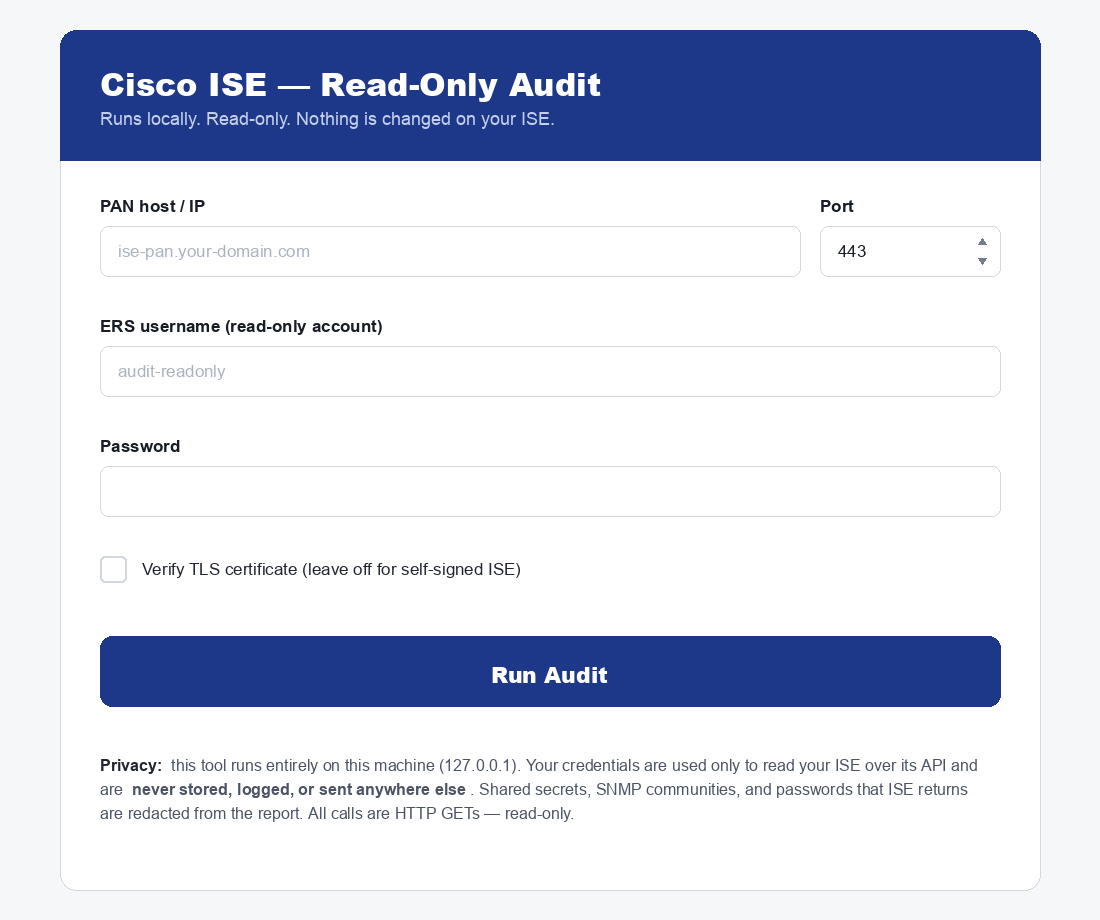
That’s the whole UI. Everything you need to drive the audit is on that one page.
Step 4 — Fill in the form and run
The fields:
| Field | What to enter |
|---|---|
| PAN host / IP | Your ISE Primary Admin Node — e.g. ise-pan.example.com or 10.1.2.3 |
| Port | 443 unless your admin has put ISE on a non-standard port |
| ERS username | The read-only audit account (e.g. audit-readonly) |
| Password | Its password |
| Verify TLS certificate | Leave unchecked if ISE uses a self-signed certificate (most do). Check it only if ISE has a CA-signed admin certificate. |
Click Run Audit. A progress screen appears: a percentage bar, the section currently being collected (network devices, policies, certificates, …), a running checklist of completed sections, and an elapsed timer. The audit takes 20–60 seconds on most deployments — when it finishes, the page automatically opens the full report. As long as the progress counter is moving (or the current section is shown), it’s working — do not close the page.
What the report actually looks like
The first page is always the executive summary. This is the slide you put in front of a CIO or CISO:
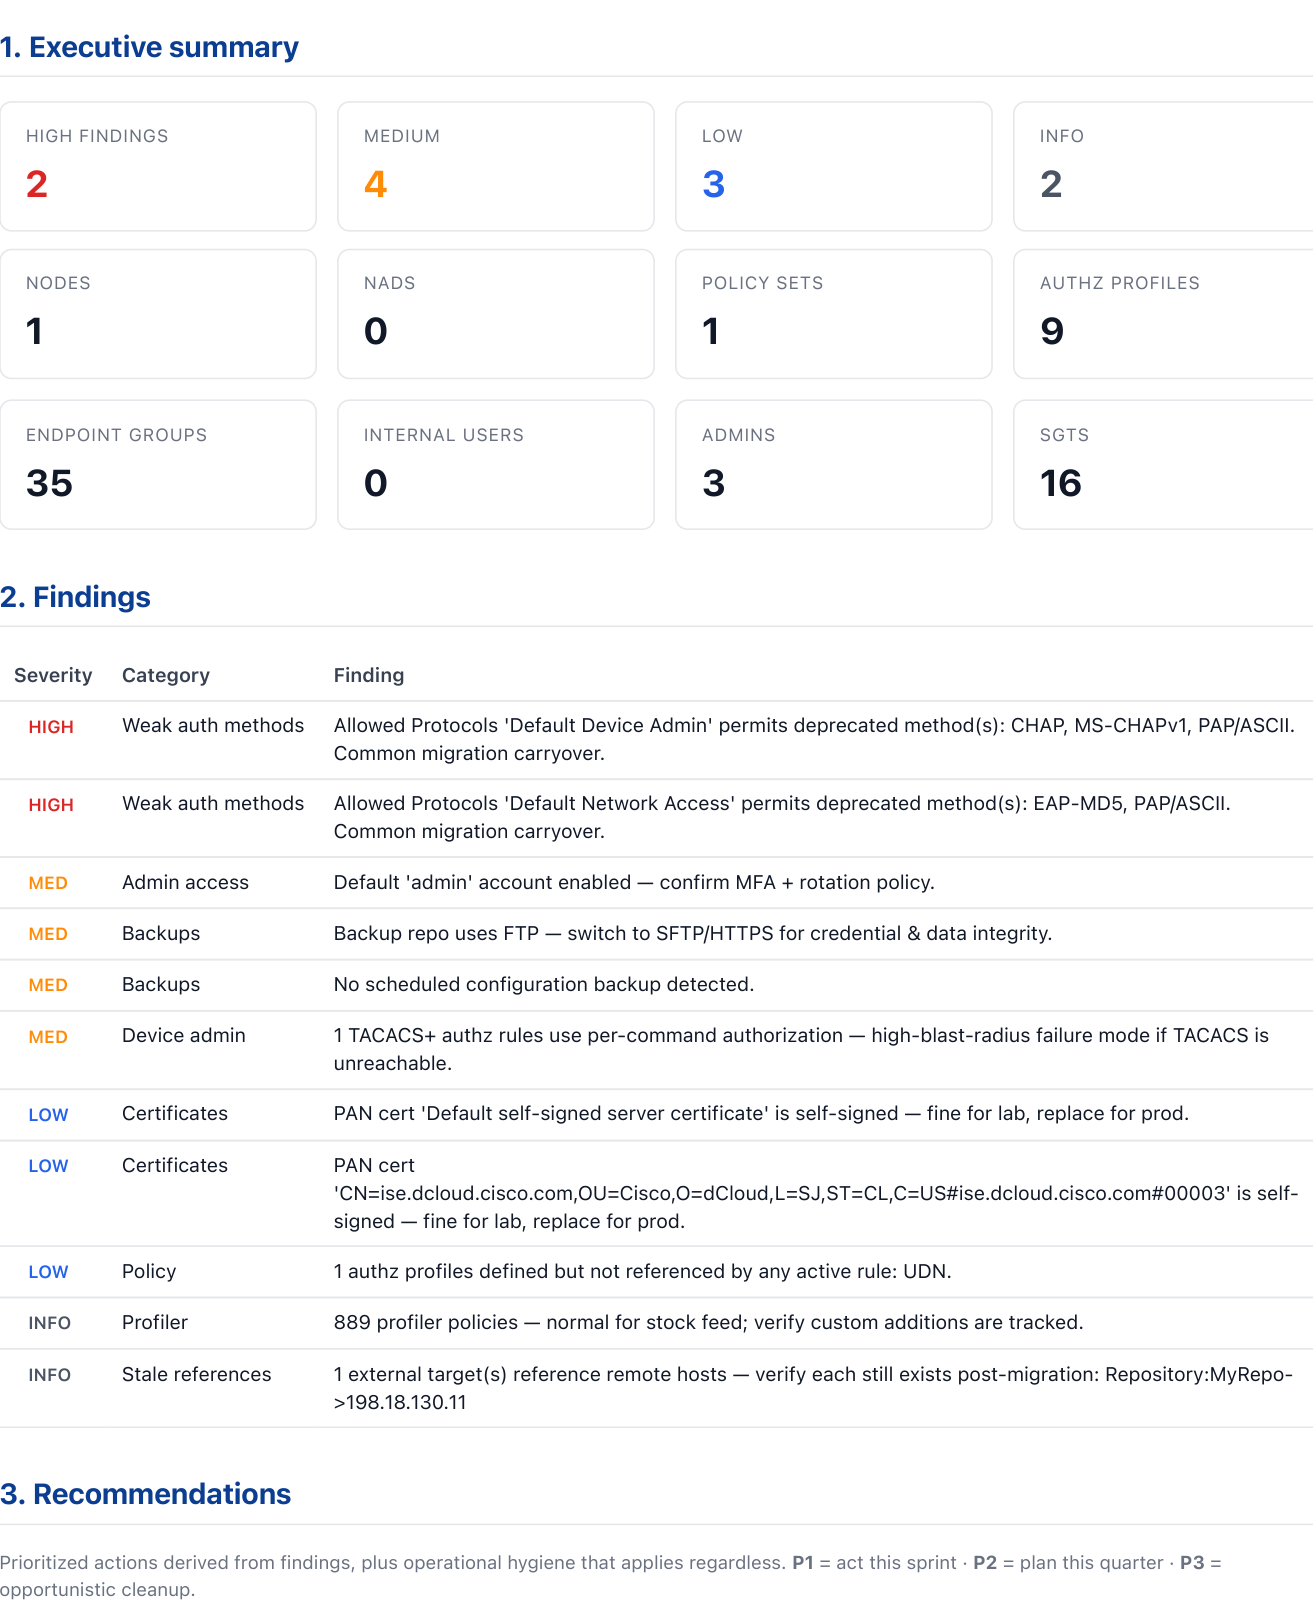
Two HIGH findings, four MEDIUM, three LOW, two INFO — eleven total. Both HIGHs in this run are weak-auth methods: deprecated protocols left enabled in the Allowed Protocols sets after some long-ago version migration. The MEDIUMs cover backups (FTP repo + no scheduled backup), admin access (default admin account still enabled), and TACACS+ per-command authorization. Every row in that table is auto-mapped to a recommendation in the next section.
The recommendations themselves are written like Jira tickets — category, effort estimate, risk, addressed findings, rationale, and numbered steps. The P1 (act this sprint) cards from this audit:
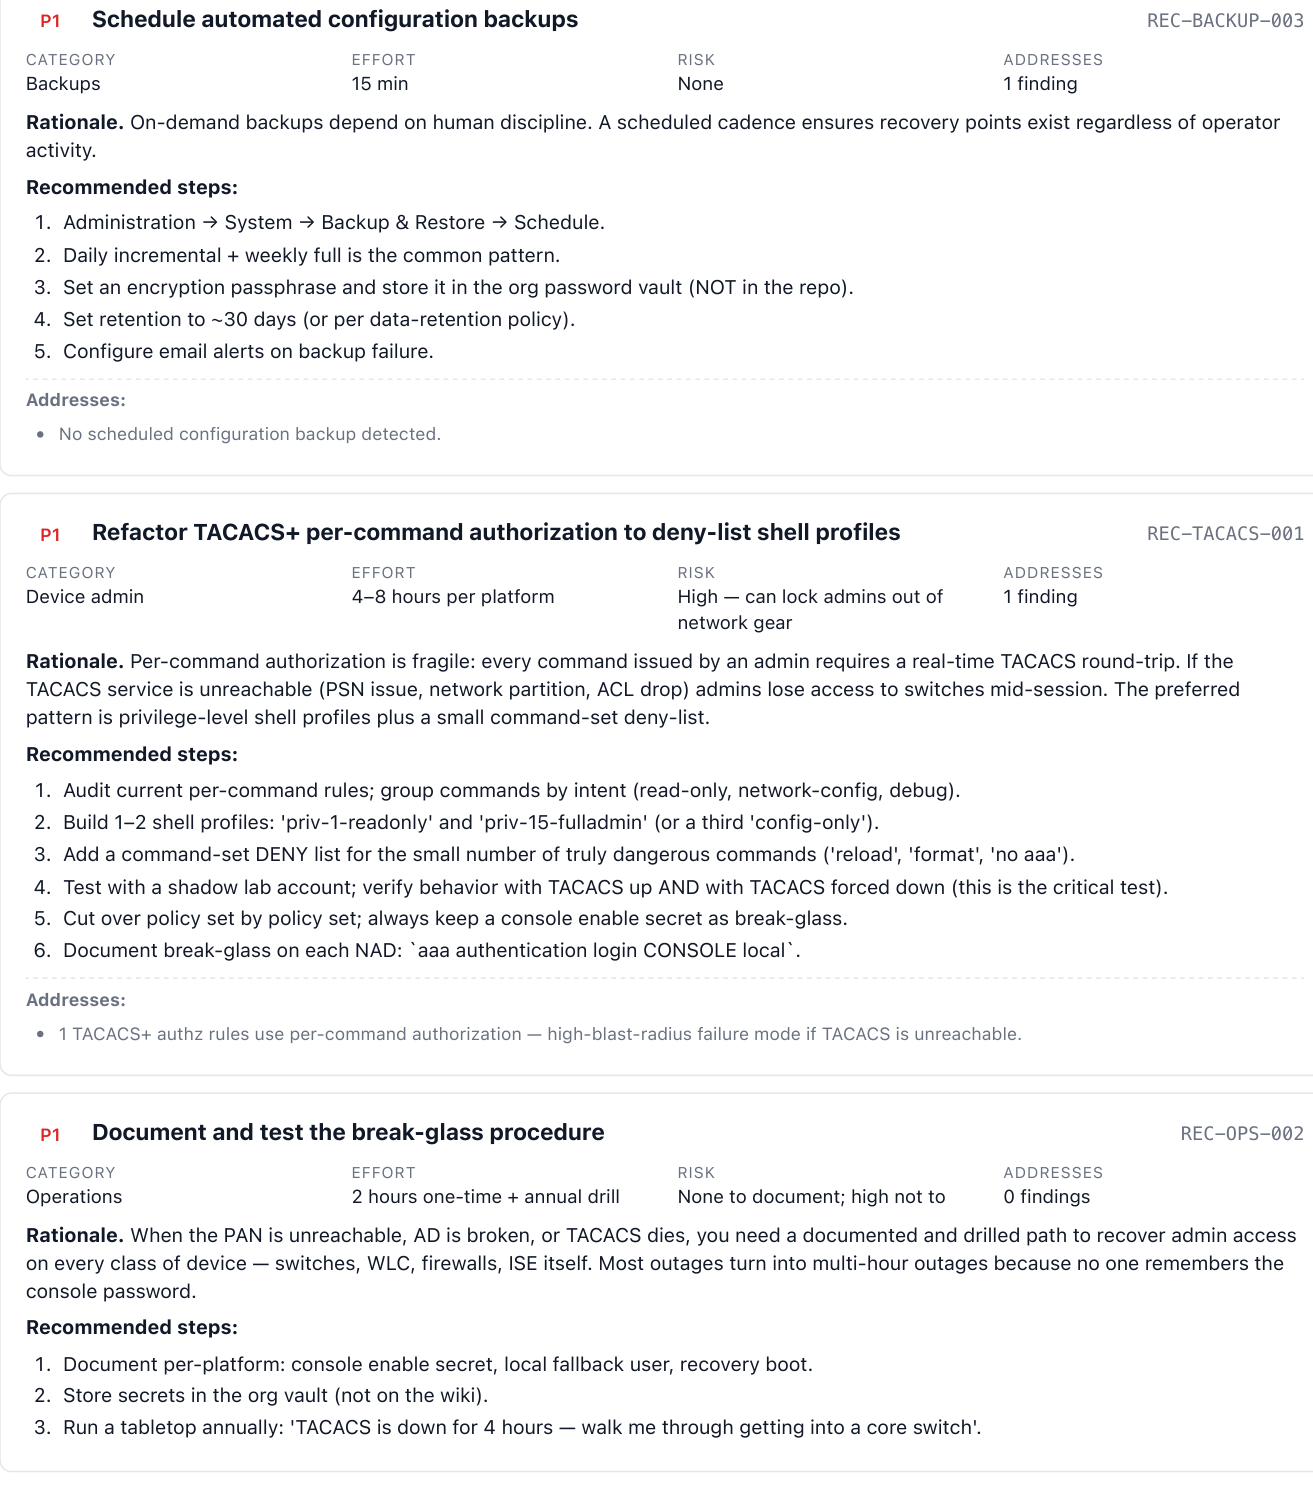
This is the part that makes the audit useful as a deliverable instead of just data. Findings without prioritized action items are noise — they create more work for the customer, not less. Pairing each finding with a P1 / P2 / P3 ticket including effort, risk, and verbatim steps is what makes the report stand alone after you hand it over.
The single most visually striking page is the authentication protocols section. Deprecated methods — PAP, CHAP, MS-CHAPv1, EAP-MD5 — get a red weak marker that’s impossible to miss:
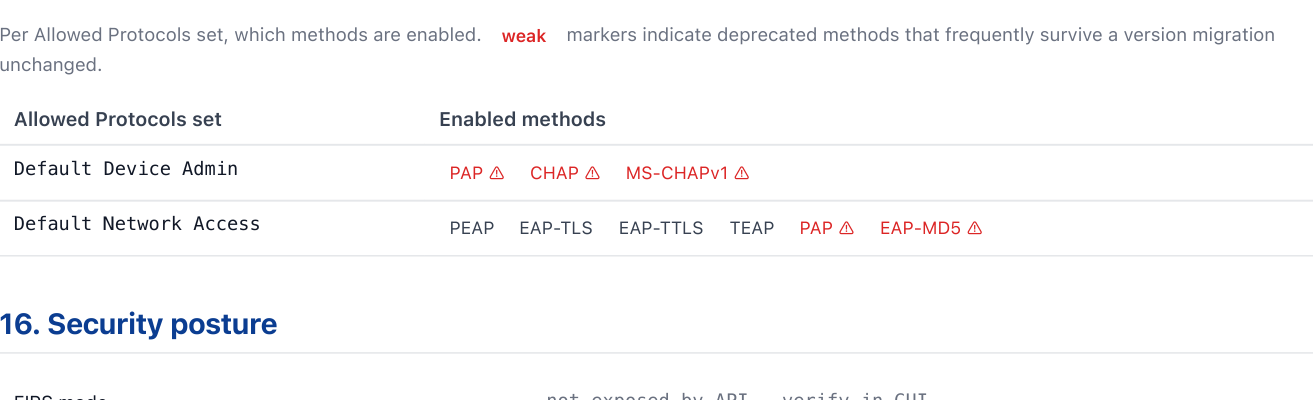
If the customer’s eyes glaze over during the rest of the report, this page will still land. Deprecated auth methods are the single most common audit finding in ISE — they survive every migration because the Allowed Protocols sets get copied verbatim, and nobody ever goes back and turns the old methods off after rolling endpoints to PEAP/EAP-TLS.
The last page is the endpoint coverage matrix — every endpoint the audit queried, with an OK or FAIL next to it:
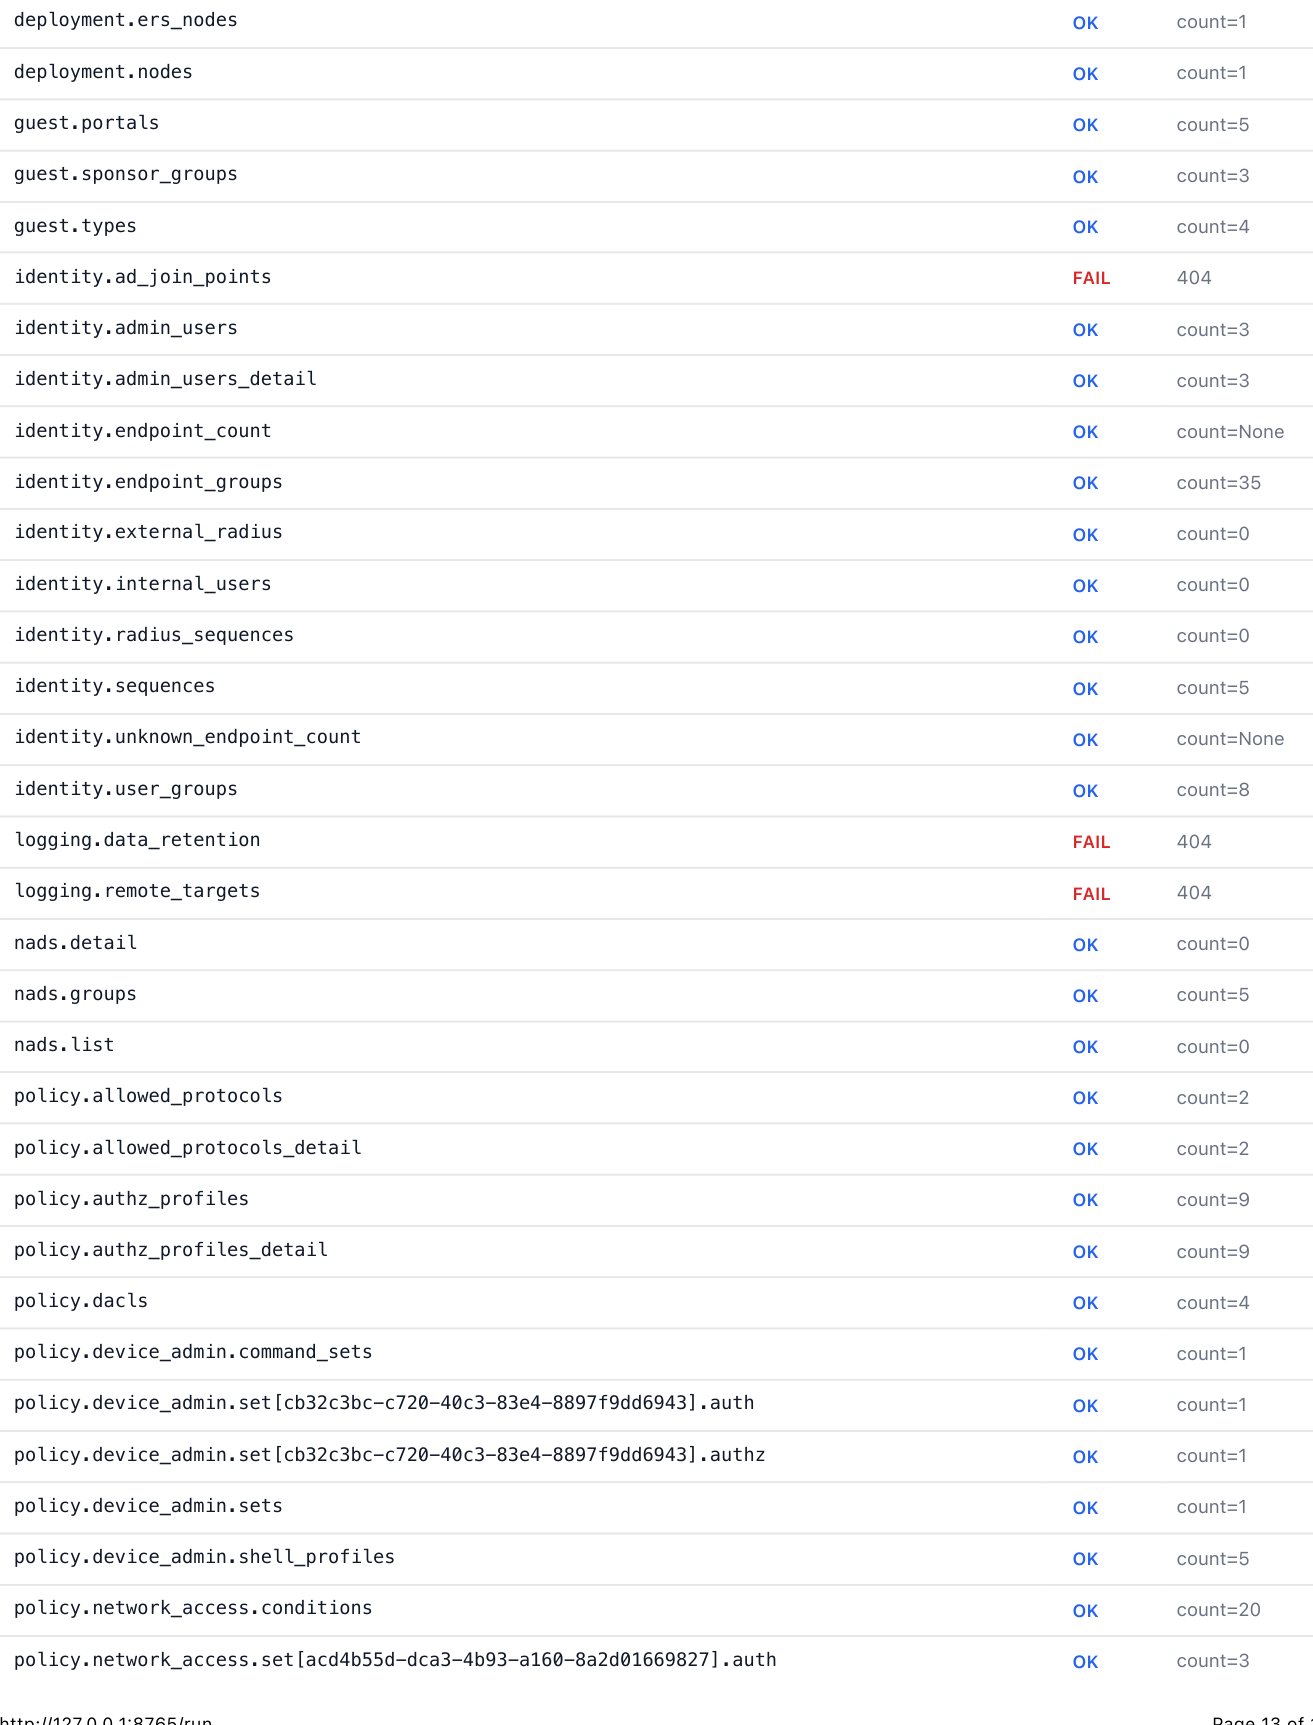
This is the page security teams ask for and rarely get from black-box scanning tools. The matrix is exactly what the audit looked at, so anything missing is provably absent — not silently skipped. The FAIL rows are mostly features this particular deployment doesn’t use (posture, pxGrid, ad-join-points, advanced backup scheduling). On a fully-loaded production ISE, more of those rows go green.
Step 5 — Save and share the results
Three buttons in the report’s top toolbar:
| Button | What you get | Typical use |
|---|---|---|
| Download JSON | Raw structured data (secrets already redacted) | Send to your consultant for offline analysis |
| Download HTML | The whole interactive report as one self-contained file | Share internally, works offline by double-clicking |
| Print / Save PDF | Browser print dialog → “Save as PDF” | Formal copy for management or compliance records |
The interactive HTML report is the one most engineers prefer day-to-day — you can filter findings by severity, search for keywords, and collapse/expand recommendations. The PDF is the deliverable; the JSON is the diff baseline for the next audit.
Step 6 — Stop the tool
Back in your terminal, press Ctrl-C. That’s it. Nothing else is running and nothing needs to be uninstalled. To remove the tool completely, delete the folder.
Troubleshooting
The error page explains most failures in plain language. The most common ones:
| Message | What it means | Fix |
|---|---|---|
| Could not connect to the host | Wrong IP / hostname, or no network path | Verify the address; confirm you can reach the ISE admin GUI from this machine; check VPN |
| Connection timed out | Host unreachable or firewall blocking 443 | Same as above |
| Authentication failed (401) | Wrong username or password | Re-check credentials in the form |
| Authorized but forbidden (403) | Account lacks API access, or ERS is disabled | The account needs the ERS Operator role and ERS must be enabled under Administration → System → Settings → API Settings |
| Port already in use when starting | A previous copy is still running | Run with another port: uv run --extra web python -m scripts.serve --port 8766 |
If you see a coverage of less than 100% — that’s expected. Features that aren’t configured (posture, pxGrid, TrustSec advanced, AD join points) don’t expose their endpoints, so the audit gets a 404 and notes it in the coverage matrix. A typical lab lands around 80%, a fully-configured production deployment around 90%.
Privacy and safety — the part security teams ask about
Worth saying explicitly because it’s the friction-point in customer conversations:
- Read-only. Every ISE call is an HTTP GET. The tool has no code path that modifies ISE configuration. You can confirm this in
python/ise_api/audit.py—session.get(...)is the only HTTP method ever invoked. - Local only. The web app binds to
127.0.0.1. Nothing listens on a routable interface. Nothing is sent to any cloud service. No telemetry, no analytics, no “phone home.” - Credentials are transient. Used once to authenticate the ERS session, held only in process memory, never written to disk and never logged.
- Secrets are redacted at the collector level. A single recursive redactor scrubs every API response before it ever reaches the JSON, HTML, or PDF. Known secret field names (
radiusSharedSecret,tacacsSharedSecret,password,snmpRoCommunity,apiKey, etc.) are replaced with<REDACTED>. Once, in one place, applied to everything downstream. - Auditable. Every line of code is in the open-source repo. Your security team can read it before you run it.
- Disposable account. The audit account can be disabled the moment the audit completes — the JSON dump is the durable artifact, not the credential.
The full privacy paragraph also appears on the form itself, beneath the Run Audit button — the customer doesn’t have to read documentation to know what the tool will do with their credentials.
When to use this — and when to stop
The 5-minute quickstart is the right path for the bottom of the funnel: a customer who’s already approved the audit, an ISE admin already comfortable with running the script themselves, an internal engineer auditing a deployment they own. It’s also the right path for the engagement you’ve been doing manually for the past few years and want to finally automate.
It is NOT the right path when:
- You’re auditing an ISE deployment you don’t own and don’t have ERS access to. For that, the strategic post covers the access-tier tradeoff and the customer-comfort conversation.
- You need a one-time customer-trust-builder where the customer wants to be in the room while the audit runs. The web UI is perfect for that — they can sit next to you, watch the progress bar fill, see the secrets-redacted note, and click “Download HTML” themselves at the end. That’s a very different conversation than handing over a CLI invocation.
- You need a recurring audit cadence (quarterly is the sweet spot per
REC-OPS-001). For that, you want the CLI variant —uv run python -m scripts.audit_deep --pdf— wired into a calendar reminder or a CI job.
Where to take this next
- For the customer-side preparation (enabling ERS, creating the read-only account, organizational politics), see
docs/02-customer-audit-runbook.mdin the repo. - For the strategic framing — why this exists, the consulting tradeoff, why “just send me the config backup” doesn’t work — see the original audit post.
- For an end-to-end ISE deployment workflow from a blank VM to a working deployment using Ansible + Claude, the ISE automation post covers the other direction (build instead of audit).
And if you want a configuration walkthrough beyond auditing — Profiling, TACACS+ device admin, and BYOD onboarding are the three companion posts that walk through the most-requested ISE features step-by-step.
Practice with free flashcards, quizzes, and hands-on lab scenarios at cciesec.it-learn.io — built specifically for the CCIE Security v6.1 written (350-701 SCOR) and lab exam.


